| home Java Script MS Access Perl HTML Delphi C ++ Visual Basic Java CGIPerl MS Excel Front Page 98 Windows 98 Ms Word Builder PHP Assembler Link to us Links |
Putting It All Together with Excel 97
What you will learn from this lesson
With Excel 97 you will:
What you should do before you start this lesson
Before you start this lesson, you need to:
Exploring the lesson
Throughout this book you have been building one skill upon another. Each step has been leading you to complete a formal report complete with charts and graphs. This chapter will use data and graphs you made in an earlier lesson and saved to the file named Technology.
Data from a worksheet can be linked into a Word document. Every time the numbers in the worksheet change, the corresponding numbers in the Word document will be updated.
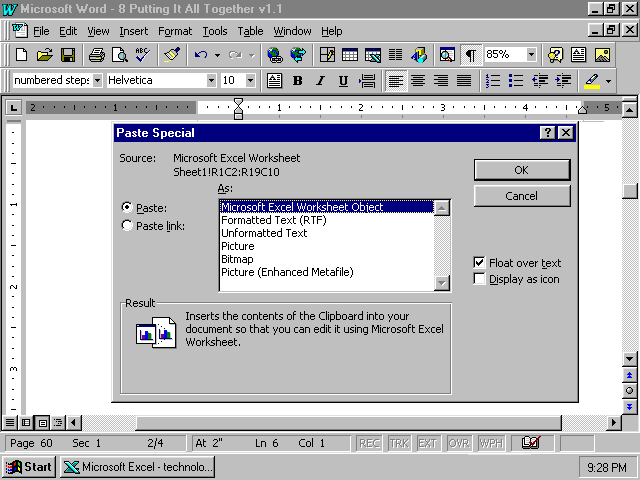
Linking data charts into a Word document
Your data chart, graphic, and WordArt are now part of your document. This method of linking the data chart to your document uses the least amount of system memory. Any changes you make in the Excel 97 worksheet will be reflected in your Word document.
Creating linked graphs
Linking a graph from Excel 97 is an easy way to ensure that any changes to your graph in Excel 97 are carried over to your graph in a Word 97 document.
Linking a graph
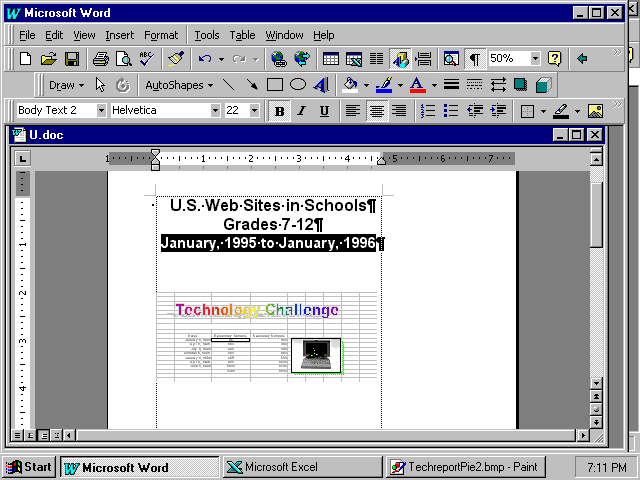
Excel 97 has linked your chart and graphic from your worksheet to your document. You can edit through Word 97 into Excel 97, but it may be slower than entering the changes directly in Excel 97, depending on your computer speed and system memory.
How you can use what you learned
You can easily insert Excel data charts and graphs into any Word document. The next time you calculate your grades, insert the data table and graph into your document. Any changes you make to the Excel worksheet will be automatically updated in your Word document.
Your monthly reports can be updated as quickly as you change the data. In letters to your students’ parents, you can quickly update the scores and grades.
Extensions
With the Excel 97 wizards, try using other chart types to view your data. Sometimes data has no recognizable pattern in one chart type but gains high impact when displayed through a different chart. If you change just a few of the chart characteristics, you may gain a different perspective of the data.
Using Excel 97 to link data tables and graphs to your Word documents adds excitement and drama to your reports, letters, and presentations. You and your students can benefit from using clear and concise graphs in your reports, letters, and presentations.
Summarizing what you learned
In this chapter you have explored and practiced: